Evaluation of Glycemic Control in Diabetes Mellitus: Important Metrics and Beyond
Accurate evaluation of glycemic control is a cornerstone of diabetes management. It provides insights into treatment efficacy, patient adherence, and forms the foundation for therapy adjustments. The major dimensions of glycemic control include average glucose levels, hypoglycemia frequency, glucose variability, and sensor-based metrics such as “time in range.” The most widely applied tools to assess these domains are hemoglobin A1C (A1C), capillary blood glucose monitoring (BGM), and continuous glucose monitoring (CGM), each offering unique strengths and inherent limitations due to how the data are generated.
Table: Overview of glycemic assessment tools and key metrics for evaluating glycemic control. Correlation strength is estimated assuming optimal patient compliance to the prescribed monitoring approach.
Hemoglobin A1C (A1C)
The A1C test remains the principal indicator for assessing long-term glycemic status in both clinical practice and research settings. It is strongly linked to the risk of developing diabetes-related complications. A1C represents the percentage of glycated hemoglobin within circulating red blood cells, which have an average lifespan of around 120 days. Glycation occurs continuously and in direct proportion to circulating glucose levels, allowing A1C to reflect mean glycemia over the preceding 2–3 months.
Table: Correlation of A1C and Estimated Average Glucose, adapted from the original article of Nathan et al (see below). Values in parentheses = 95% CI of Data Based on ca. 2700 readings per A1C in ADAG trial:
Nathan DM, Kuenen J, Borg R, Zheng H, Schoenfeld D, Heine RJ; A1c-Derived Average Glucose Study Group. Translating the A1C assay into estimated average glucose values. Diabetes Care. 2008 Aug;31(8):1473-8. doi: 10.2337/dc08-0545. Epub 2008 Jun 7. Diabetes Care. 2009 Jan;32(1):207. PMID: 18540046; PMCID: PMC2742903.
Because A1C reflects glucose exposure indirectly, any condition that alters red blood cell turnover or hemoglobin structure can influence its interpretation. Such factors include anemia, hemoglobinopathies, chronic kidney disease, or recent transfusion.
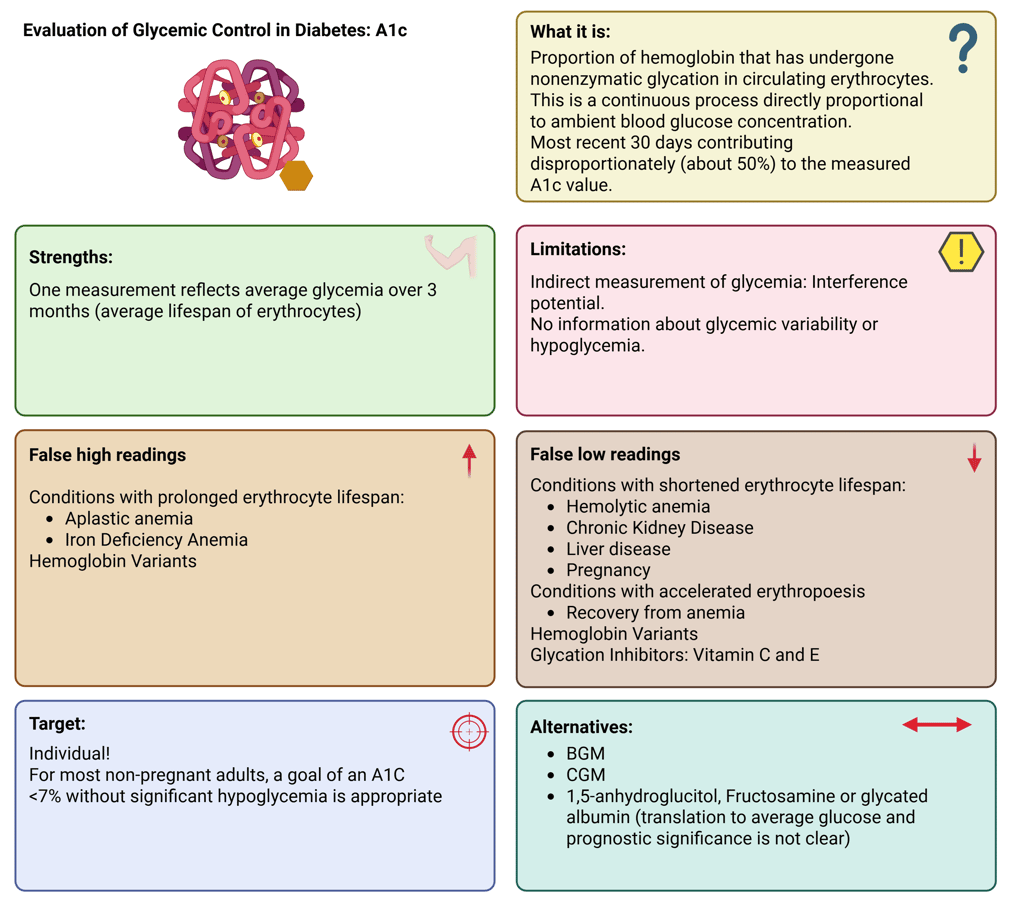

Illustration: A1C: Definition, Strengths and Limitations
In stable adults with type 1 or type 2 diabetes who are consistently meeting glycemic targets, A1C measurement twice yearly is generally sufficient. In contrast, individuals with unstable glucose levels, intensive insulin regimens, or recent therapy changes may require testing every three months or more frequently. For most non-pregnant adults, an A1C goal below 7%, achieved without significant hypoglycemia, is recommended.
This target is supported by the Diabetes Control and Complications Trial (DCCT), which demonstrated that intensive glycemic control (mean A1C ≈7%) reduced the risk of microvascular complications (retinopathy, nephropathy, and neuropathy) by 50–76% compared with conventional management (mean A1C ≈9%).
Alternative Biomarkers: Fructosamine, Glycated Albumin and 1,5-Anhydroglucitol
Fructosamine and glycated albumin offer complementary insights by reflecting average glucose levels over the preceding 2–4 weeks, due to the shorter turnover of serum proteins. Fructosamine measures total glycated serum proteins, while glycated albumin quantifies the proportion of albumin that is glycated. Although these biomarkers are clinically approved, the evidence base supporting their use is less robust than for A1C. They may be particularly useful when A1C is unreliable or cannot be measured, such as in individuals with hemoglobin variants, anemia, or rapid red blood cell turnover.
1,5-Anhydroglucitol (1,5-AG) represents another alternative biomarker for short-term glycemic assessment. It is a naturally occurring monosaccharide (polyol) structurally analogous to glucose and normally circulates in relatively stable plasma concentrations under normoglycemic conditions. 1,5-AG is freely filtered through the glomerulus and almost completely reabsorbed in the proximal renal tubule. When plasma glucose levels exceed the renal threshold (approximately 180 mg/dL or 10 mmol/L), glucose competitively inhibits its reabsorption, leading to urinary loss of 1,5-AG and a subsequent decline in serum concentration.
Because of this mechanism, serum 1,5-AG levels vary inversely with glucose exposure, showing the strongest correlation during periods of hyperglycemia; particularly after meals or during glycemic excursions. A low 1,5-AG concentration therefore indicates recent (1–2 weeks) hyperglycemic episodes and provides complementary insight into short-term glycemic control and variability that may not be captured by A1C or fructosamine measurements.
Capillary Blood Glucose Monitoring (BGM)
Self-monitoring of blood glucose remains an integral component of diabetes care, particularly for individuals using insulin. BGM involves measuring glucose concentration in a small capillary blood sample, usually from a fingerstick, applied to a test strip containing glucose-reactive enzymes (glucose oxidase or glucose dehydrogenase). The enzymatic reaction produces an electrical signal proportional to glucose concentration, which is displayed as a digital value.
The major limitation of BGM lies in its episodic nature, data depend entirely on patient measurements. Hypoglycemia is only captured when the patient tests during the event, and frequent fingersticks can reduce adherence. Nevertheless, structured BGM (e.g., pre- and post-meal testing or during specific situations) can provide valuable insights into daily glucose patterns.
False low or high readings in capillary-based blood glucose meters can result from interfering substances, physiological variables, and environmental influences. Among these, hematocrit variation is a major determinant of inaccuracy: low hematocrit may cause falsely elevated glucose results, whereas high hematocrit tends to yield falsely low values.
Environmental and pre-analytical factors are also significant. Improper storage or handling of test strips, including exposure to humidity, temperature extremes, or use of expired strips, can distort measurements. Contamination at the sampling site (e.g., glucose-containing lotions or food residues) and user-related errors, such as inadequate blood application or incorrect strip insertion, further contribute to unreliable readings.
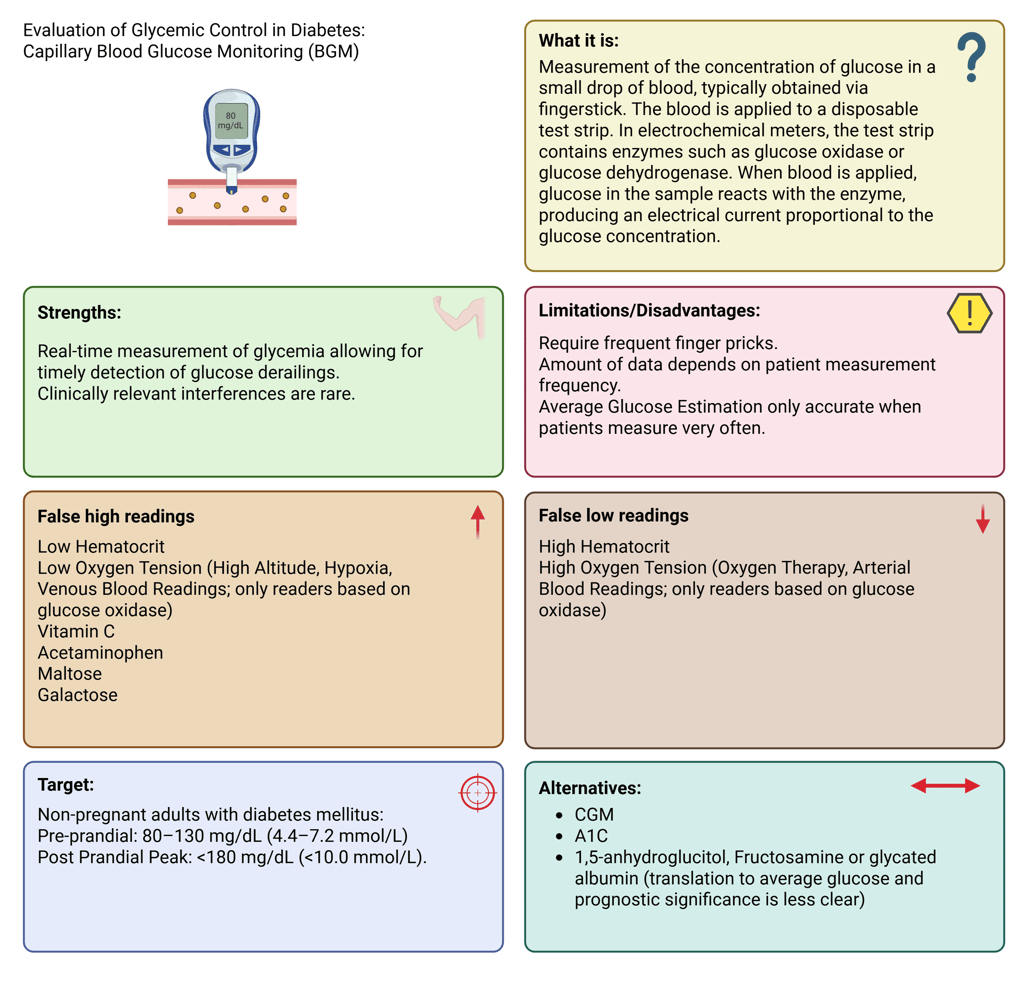
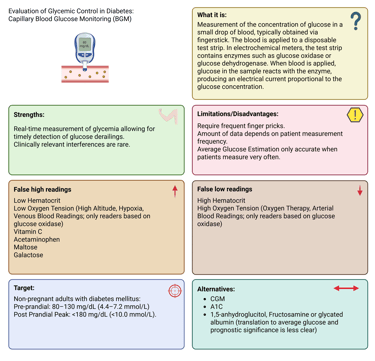
Illustration: Cappillary Blood Glucose Measurement: Definition, Strengths and Limitations
Continuous Glucose Monitoring (CGM)
CGM systems have become the standard of care for most individuals with type 1 diabetes and are increasingly used in type 2 diabetes. These devices measure glucose levels in the interstitial fluid using a subcutaneous sensor containing a glucose-sensitive enzyme, usually glucose oxidase. The generated signal is transmitted to a receiver or smartphone, displaying glucose levels and trends in real time or upon scanning.
Because interstitial glucose lags behind plasma glucose by approximately 5 minutes at rest (and up to 20 minutes during rapid changes such as meals or exercise), discrepancies may occur during acute fluctuations (physiological lag). Therefore, confirmatory capillary glucose testing is recommended when CGM readings and symptoms do not align or when glucose levels are changing rapidly.
Sensor accuracy can be influenced by external and physiological factors. Certain medications (e.g., acetaminophen, high-dose vitamin C, hydroxyurea, mannitol, sorbitol) can cause falsely elevated readings in specific devices, whereas compression artifacts (e.g., lying on the sensor) can transiently lower readings. Device-specific guidance should always be considered.
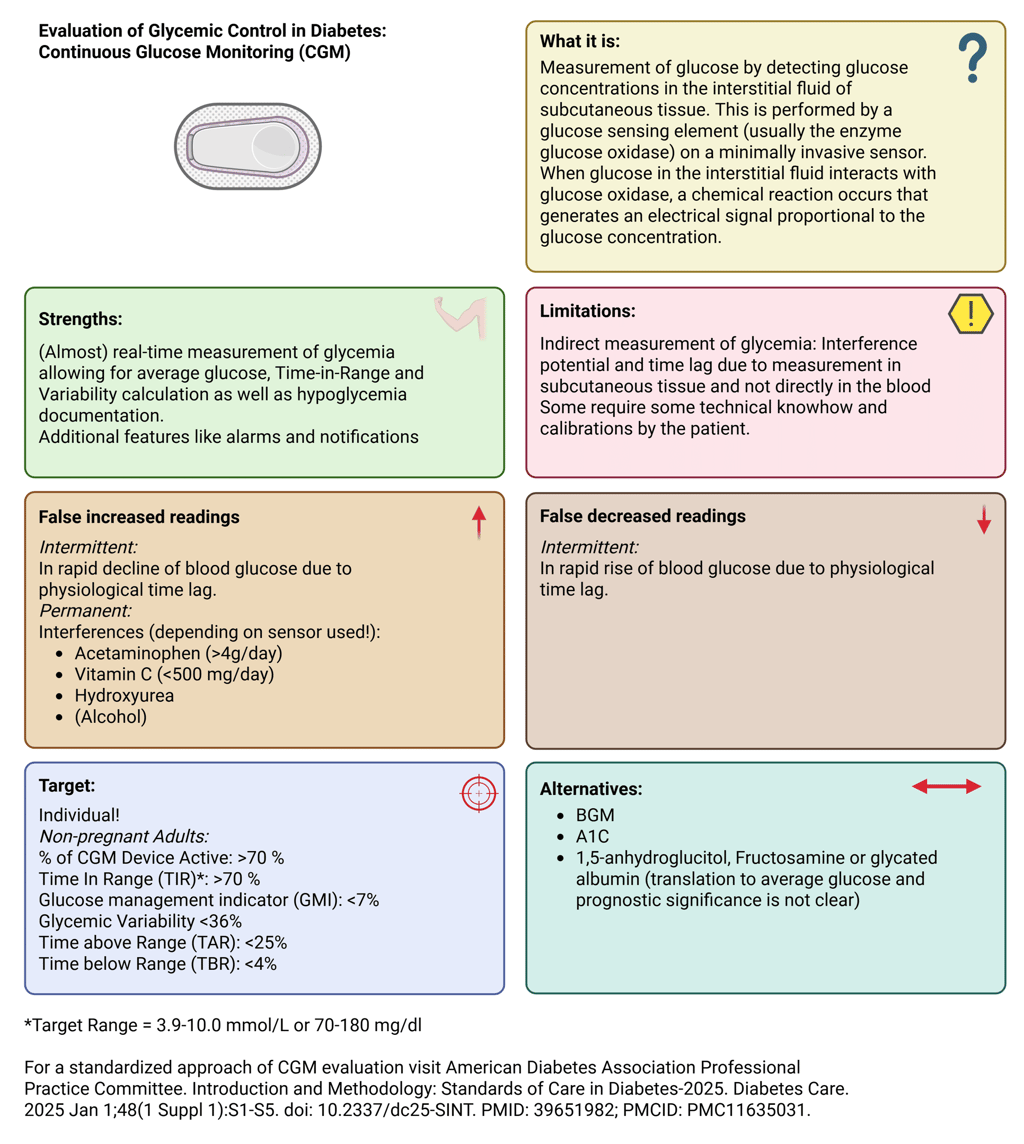
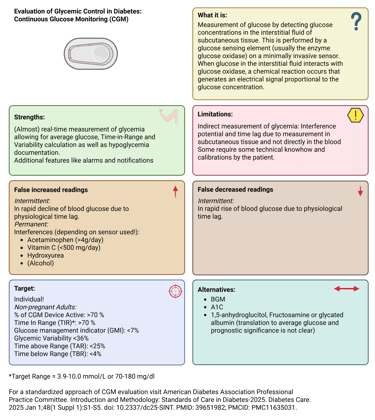
Illustration: Continuous Glucose Measurement: Definition, Strengths and Limitations
Integrative Assessment
For individuals with significant glycemic variability, especially those with insulin-treated type 1 or advanced type 2 diabetes, the best picture of glucose control emerges from combining A1C results with data from CGM or BGM. The same principle applies to individuals using CGM. Although this technology provides multiple metrics of glycemic control, including an estimated A1C known as the Glucose Management Index (GMI), correlating CGM data with laboratory A1C or capillary glucose measurements remains valuable in specific clinical scenarios, such as when sensor inaccuracy is suspected or in the evaluation of hypoglycemia.
Beyond the Numbers
Quantitative metrics must always be interpreted in the context of the individual. Clinicians should, among other factors, assess:
Adherence to therapy (prescription does not always equal administration)
Technical competence in using monitoring devices
Glycemic events outside of the reported data
Unrecorded factors affecting glucose (e.g., illness, exercise, travel, stress)
The patient’s ability to adapt therapy to daily life situations such as swimming or changes in diet/routine
Numbers tell only part of the story; people with diabeteslive complex lives shaped by work, stress, family, and countless variables that influence glucose control. True, sustained glycemic control is achieved only when objective data are interpreted in the context of each patient’s daily experiences, challenges, and routines.
References
All Illustrations were created Created in https://BioRender.com
Nathan DM, Kuenen J, Borg R, Zheng H, Schoenfeld D, Heine RJ; A1c-Derived Average Glucose Study Group. Translating the A1C assay into estimated average glucose values. Diabetes Care. 2008 Aug;31(8):1473-8. doi: 10.2337/dc08-0545. Epub 2008 Jun 7. Erratum in: Diabetes Care. 2009 Jan;32(1):207. PMID: 18540046; PMCID: PMC2742903.
Sacks DB, Arnold M, Bakris GL, Bruns DE, Horvath AR, Lernmark Å, Metzger BE, Nathan DM, Kirkman MS. Guidelines and Recommendations for Laboratory Analysis in the Diagnosis and Management of Diabetes Mellitus. Diabetes Care. 2023 Oct 1;46(10):e151-e199. doi: 10.2337/dci23-0036. PMID: 37471273; PMCID: PMC10516260.
Saudek CD, Derr RL, Kalyani RR. Assessing glycemia in diabetes using self-monitoring blood glucose and hemoglobin A1c. JAMA. 2006 Apr 12;295(14):1688-97. doi: 10.1001/jama.295.14.1688. PMID: 16609091
Diabetes Control and Complications Trial (DCCT): results of feasibility study. The DCCT Research Group. Diabetes Care. 1987 Jan-Feb;10(1):1-19. doi: 10.2337/diacare.10.1.1. PMID: 2882967.
Albloui F, John J, Alghamdi O, Alseraye F, Alqahtani A, Tamimi W, Albloshi A, Aldakheel FM, Mateen A, Syed R. Effect of hematocrit, galactose and ascorbic acid on the blood glucose readings of three point-of-care glucometers. Scand J Clin Lab Invest. 2022 Nov-Dec;82(7-8):563-570. doi: 10.1080/00365513.2022.2138779. Epub 2022 Nov 4. PMID: 36332153.
American Diabetes Association Professional Practice Committee. 6. Glycemic Goals and Hypoglycemia: Standards of Care in Diabetes-2025. Diabetes Care. 2025 Jan 1;48(1 Suppl 1):S128-S145. doi: 10.2337/dc25-S006. PMID: 39651981; PMCID: PMC11635034.
American Diabetes Association Professional Practice Committee. 7. Diabetes Technology: Standards of Care in Diabetes-2025. Diabetes Care. 2025 Jan 1;48(1 Suppl 1):S146-S166. doi: 10.2337/dc25-S007. Erratum in: Diabetes Care. 2025 Apr 1;48(4):666. doi: 10.2337/dc25-er04b. PMID: 39651978; PMCID: PMC11635043.
Lee I, Probst D, Klonoff D, Sode K. Continuous glucose monitoring systems - Current status and future perspectives of the flagship technologies in biosensor research. Biosens Bioelectron. 2021 Jun 1;181:113054. doi: 10.1016/j.bios.2021.113054. Epub 2021 Feb 2. PMID: 33775474.
© 2025 EndoCases. All rights reserved.
This platform is intended for medical professionals, particularly endocrinology residents, and is provided for educational purposes only. It supports learning and clinical reasoning but is not a substitute for professional medical advice or patient care. The information is general in nature and should be applied with appropriate clinical judgment and in accordance with local guidelines.
Portions of the text on this website were edited with the assistance of Artificial Intelligence to improve grammar and phrasing, as English is not my first language. All medical content, ideas for illustrations, and overall structure are original and based on the author’s own expertise and the cited medical literature. No AI tools were used to generate or influence the educational content itself.
All of the content is independent of my employer.
Use of this site implies acceptance of our Terms of Use
Contact us via E-Mail: contact@endo-cases.com